Three landmarks in the gamma profile
HedgePulse reduces a signed gamma-exposure profile into three scan-friendly landmarks: NG, ZG, and PG. They are derived from the selected options scope and level basis, so they can change as the underlying data changes.
NG: strongest negative gamma
NG is the strike with the lowest negative gamma-exposure value. It identifies the strongest negative point in the profile for the selected basis.
PG: strongest positive gamma
PG is the strike with the highest positive gamma-exposure value. It identifies the strongest positive point in the profile for the selected basis.
ZG: the structural zero crossing
ZG is not simply the nearest strike whose value happens to be zero. HedgePulse locates the transition band between negative and positive gamma inside the NG-to-PG structure, then interpolates the crossing from the signed values on each side.
That means ZG can fall between listed strikes.
What the table display tells you
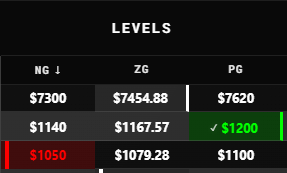
The level columns can show the calculated price or the current price's normalized distance from the level, depending on your table settings. Tooltips report whether price is above, below, or at the level.
A check mark means the current session range has touched the level. It does not mean the level held or produced a reversal.
Combine location with context
Use gamma levels as location references, then check participation, STRAT structure, exposure totals, and Expected Move. A level is more useful when you can explain what the surrounding columns are saying.
These levels are analytical outputs and can move as options data, price, expiration scope, or the selected OI/volume basis changes.