What the STRAT Matrix measures
Each cell classifies the current candle relative to prior candle structure for one timeframe. HedgePulse calculates the same rule set from 1 minute through month, letting you scan continuity without opening eight charts.
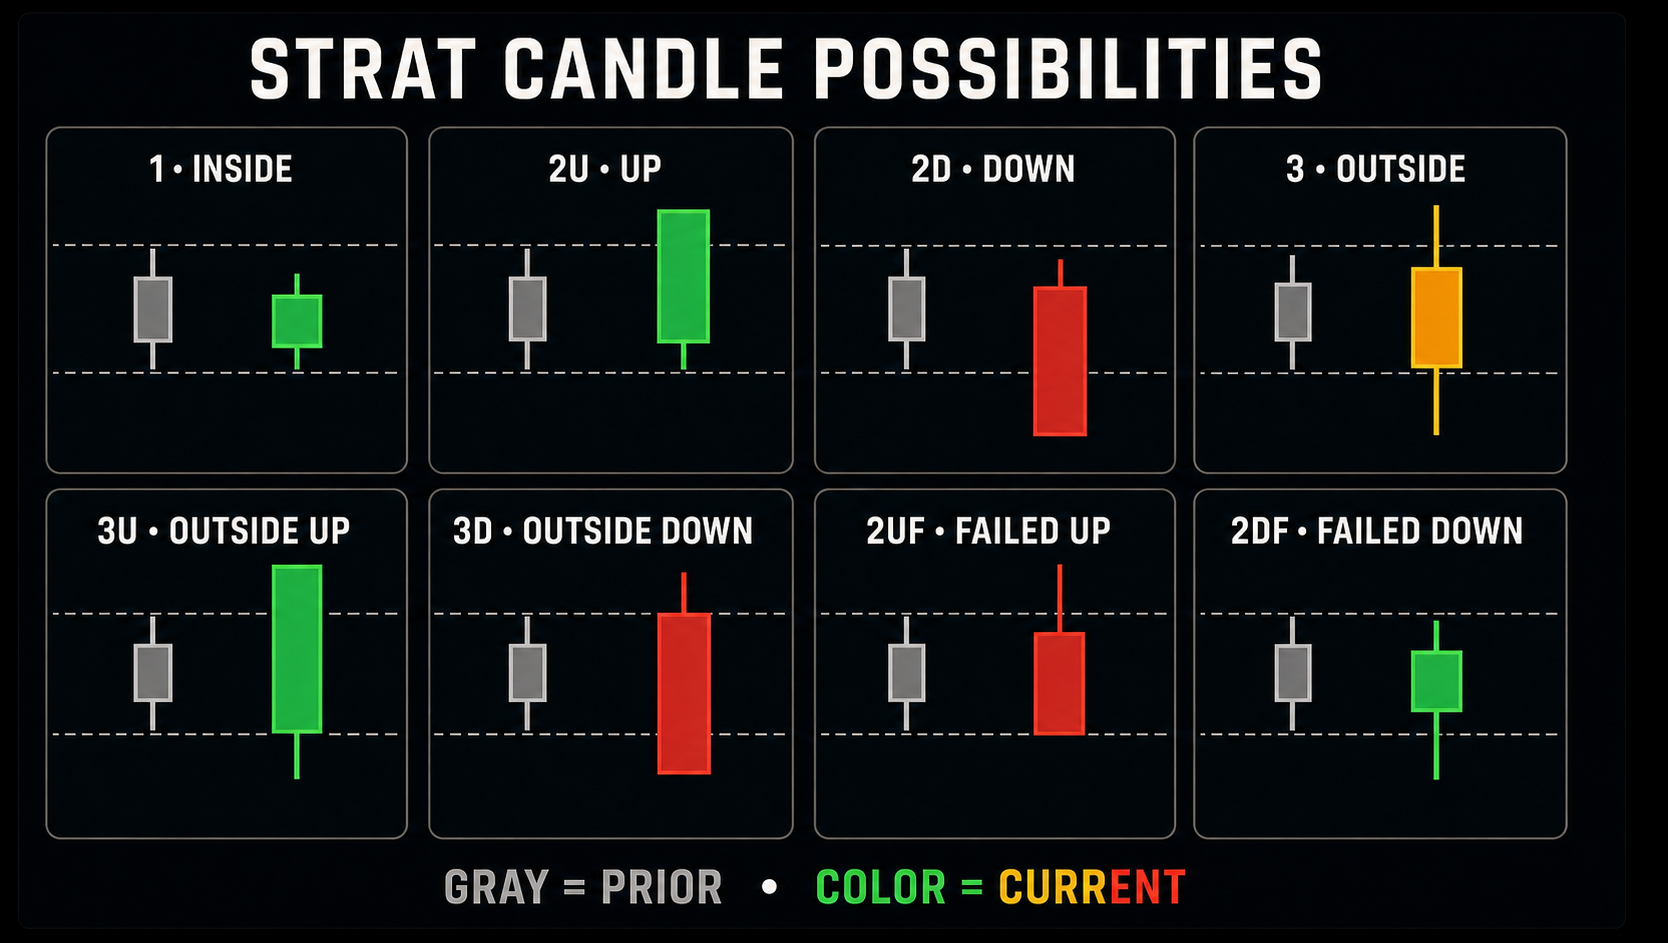
The three base scenarios
| Signal | Application rule | Meaning |
|---|---|---|
| 1 | Current high is at or below the prior high and current low is at or above the prior low | Inside candle; range compression. |
| 2u | Current candle trades above the prior high without taking the prior low, then closes above the prior high | Confirmed upward directional break. |
| 2d | Current candle trades below the prior low without taking the prior high, then closes below the prior low | Confirmed downward directional break. |
| 3 | Current candle trades above the prior high and below the prior low, then closes inside the prior range | Outside candle with a neutral close. |
| 3u / 3d | Outside candle closes above the prior high or below the prior low | Outside expansion with confirmed direction. |
Failed directional breaks
2uF means the candle traded above the prior high but closed back inside the prior range. It is a failed upward break and is classified as reversal-down context.
2dF means the candle traded below the prior low but closed back inside the prior range. It is a failed downward break and is classified as reversal-up context.
The candle color can still matter for neutral or failed structures, which is why the application preserves green/red prefixes internally for selected labels.
Multi-candle sequences
- 1-1 means two consecutive inside candles.
- iUp means a prior inside candle is followed by a close above its high.
- iDn means a prior inside candle is followed by a close below its low.
- 3-2u means a prior outside candle is followed by an upward continuation close.
- 3-2d means a prior outside candle is followed by a downward continuation close.
- GapUp / GapDn means the current candle's entire range is above or below the prior candle's range.
How to read continuity
Begin with the broader timeframes, then work toward the shorter ones. If day, week, and month point in the same direction, shorter-timeframe signals can be read inside that larger context. When the row alternates between red, green, and neutral, continuity is mixed.
The matrix describes candle structure. It does not predict that the next candle must continue, and it does not replace risk management.