Why history changes the read
The Indicator Table is designed for a fast current-state scan. Exposure Flow and Level History answer the next question: how did the current state get here?
A current exposure value can look important but be stable for hours. A level can sit near price but be moving steadily. History separates a static reference from a developing change and keeps that change aligned with the underlying price.
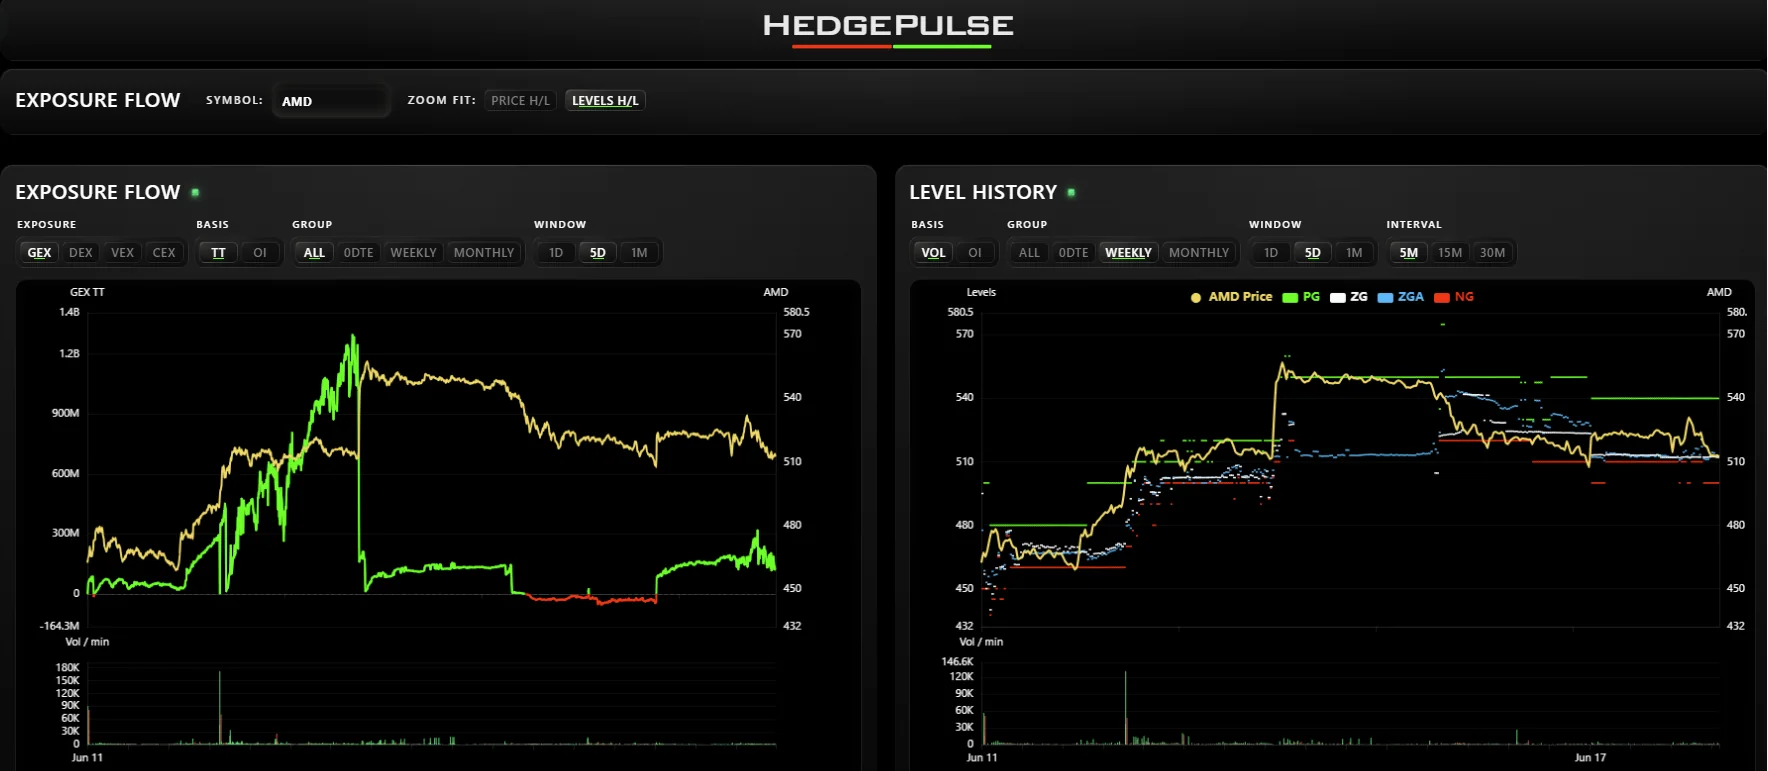
The two charts have different jobs
Exposure Flow
Exposure Flow plots the selected aggregate exposure measure through time. The available measures are:
| Control | Meaning |
|---|---|
| GEX | Gamma exposure |
| DEX | Delta exposure |
| VEX | Vanna exposure |
| CEX | Charm exposure |
Each line must be read with its selected basis, expiration group, and window. Changing one of those controls changes the population or calculation being displayed.
Level History
Level History plots calculated PG, ZG, GF, and NG references beside the underlying price. Instead of asking only "Where is ZG now?" it lets you ask "Has ZG been stable, stepping higher, stepping lower, or converging with price?"
For the core PG, ZG, and NG calculation language, read NG, ZG, and PG: Reading HedgePulse Gamma Levels.
Understand every control
Basis
Exposure Flow offers VOL and OI. Level History offers VOL, OI, and Both.
- OI uses the open-interest basis.
- VOL uses the traded-volume basis.
- Both overlays both level sets. OI lines are solid and VOL lines are dashed so the two bases stay distinguishable.
Do not compare a VOL line with an OI line as if they were repeated copies. They answer related but different questions about the selected options population.
Group
The expiration group can be All, 0DTE, Weekly, or Monthly. Keep this control explicit because a short-dated change can be large without representing the same horizon as all expirations.
Window
The available history windows are 1D, 5D, and 1M.
- 1D is best for the shape of one trading session and enables previous or next session navigation.
- 5D shows whether the current session differs from the recent week.
- 1M favors larger, slower changes over minute detail.
Level interval
Level History can hold the level series at 1-minute, 5-minute, 15-minute, or 30-minute intervals. Price and timestamps retain their full chart resolution; the interval controls how often the displayed level series refreshes.
The available choices become coarser as the history window grows: 1D supports all four intervals, 5D begins at 5 minutes, and 1M uses 30 minutes. That keeps longer views readable.
Use the synchronized view
The charts share the selected symbol, history window, 1D session, and zoom range. Zooming into a section of one chart aligns the other chart to the same portion of history.
The Zoom Fit control changes the shared price-axis emphasis:
- Price H/L fits the visible underlying price range.
- Levels H/L fits the visible calculated level range.
Use Price H/L when candle movement is compressed by distant levels. Use Levels H/L when the relationship among the level lines is the main question.
What to look for
Change with price confirmation
Ask whether an exposure or level change occurs while price is moving, after price has moved, or without meaningful price response. Timing helps distinguish a developing relationship from a static coincidence.
Stable versus drifting levels
A stable level provides a consistent reference. A drifting level changes the location of that reference through the session. Neither behavior guarantees a reaction, but each changes how a nearby price test should be framed.
Agreement between bases
In Both mode, OI and VOL level sets may cluster or separate. Agreement can make a location easier to identify. Separation shows that the open-interest and traded-volume calculations are emphasizing different strikes.
Expiration concentration
Compare All with 0DTE, Weekly, or Monthly only when you have a specific horizon question. A concentrated move in one group is information about that group, not automatic proof that every expiration is aligned.
Move from snapshot to history
- Select the symbol and start with the 1D window.
- Choose one exposure measure and one basis.
- Begin with All expirations, then isolate a group only to answer a narrower question.
- Compare the exposure line with price timing.
- Read Level History in the same zoom range.
- Use Both mode when basis agreement is part of the question.
- Move to 5D or 1M to decide whether today is typical or unusual.
- Return to the Indicator Table for the current snapshot.
History improves context. It does not turn an exposure line or calculated level into a guaranteed forecast.
Avoid comparison errors
- Forgetting which basis or expiration group is active.
- Comparing different windows as if they have the same resolution.
- Reading a level near price without checking whether it has been drifting.
- Assuming a change in exposure must cause an immediate price move.
- Using Both mode without distinguishing solid OI lines from dashed VOL lines.