Replay a stored session
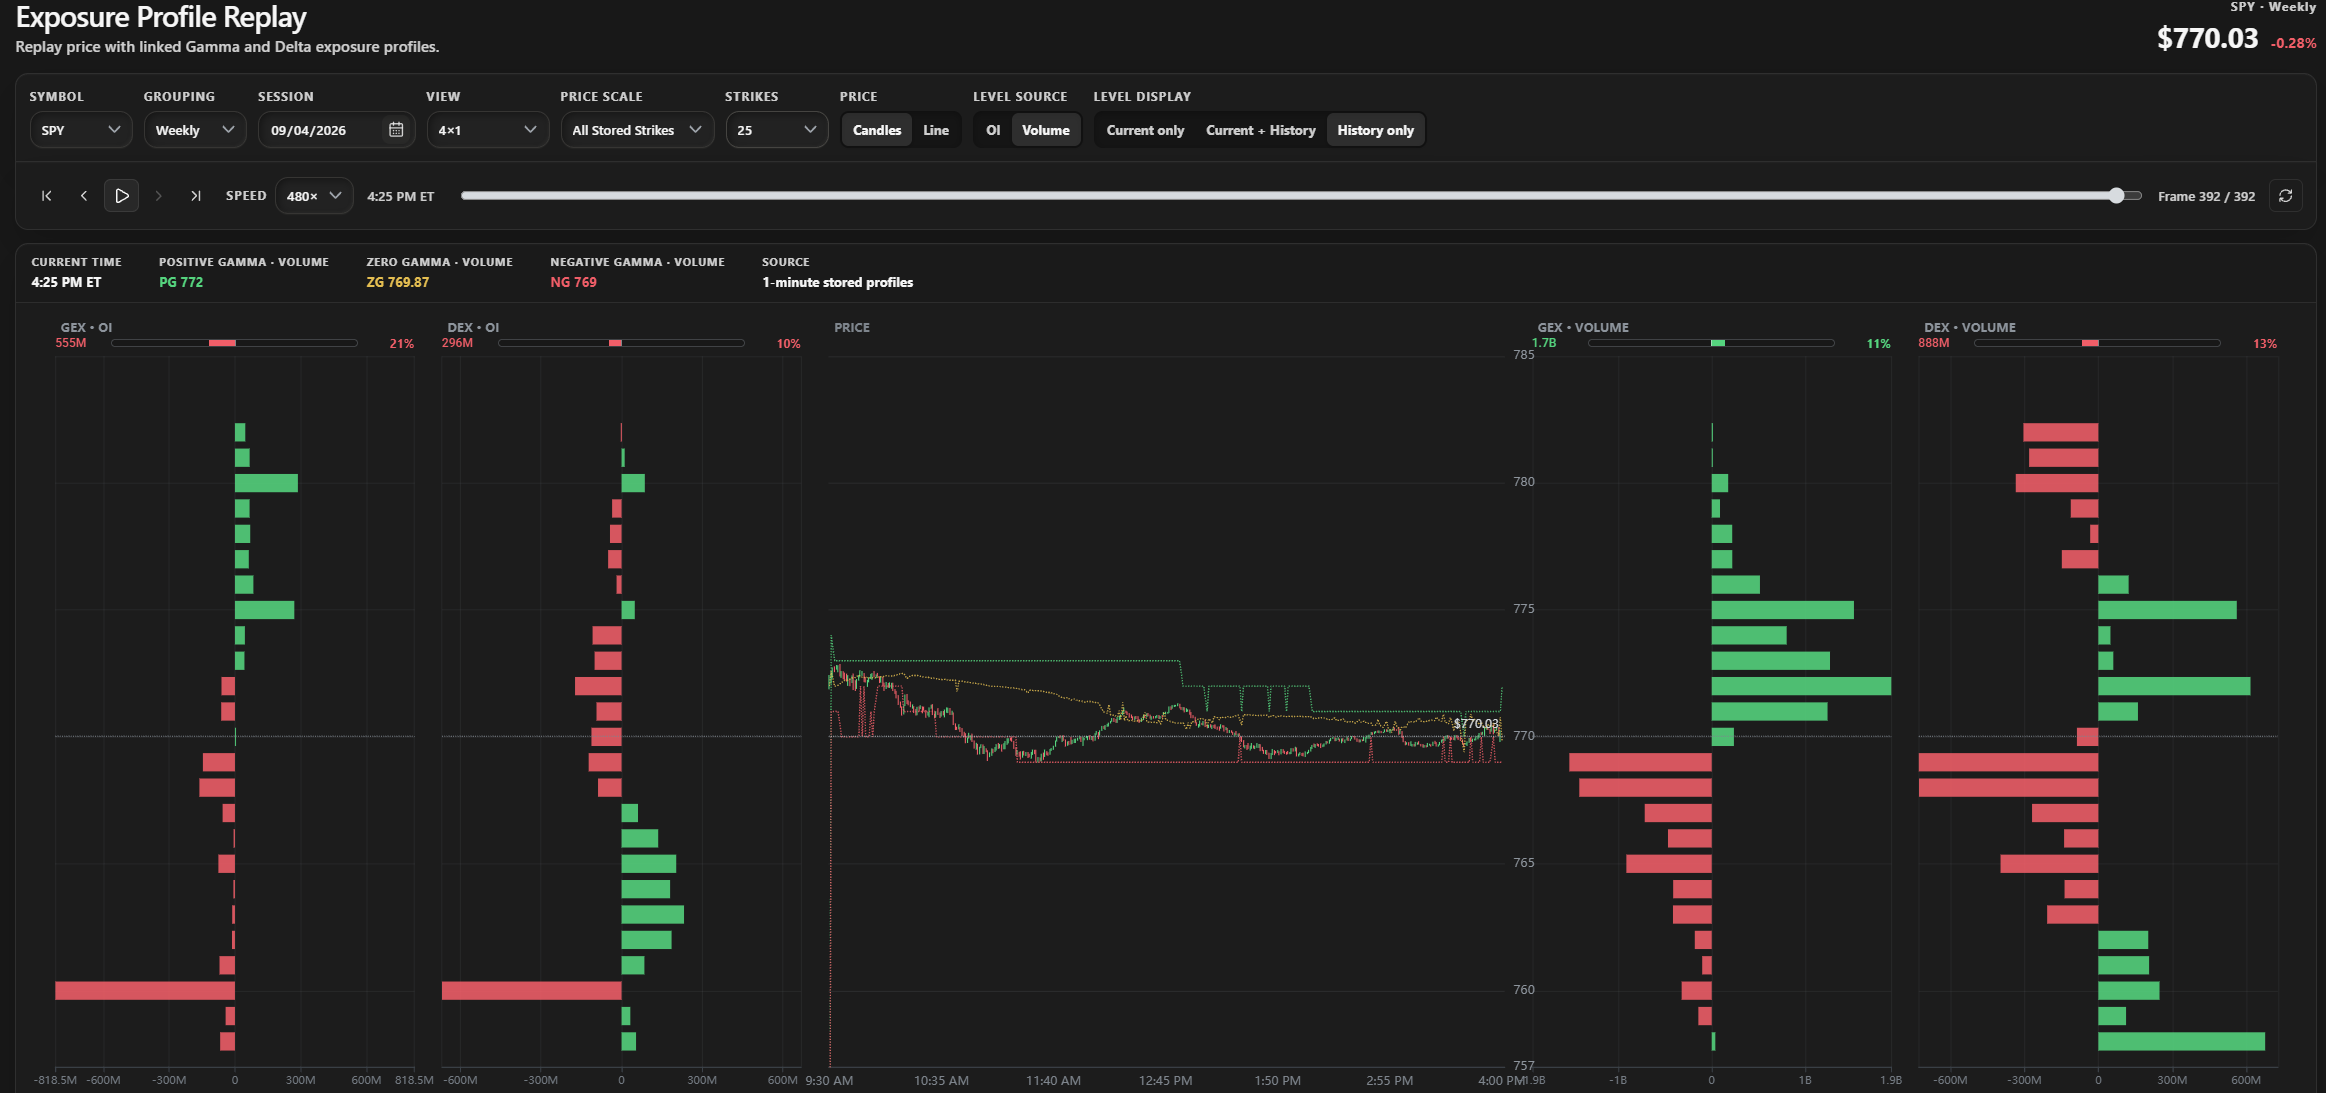
SPY Weekly, September 4, 2026. A stored-session example using the 4×1 view.
Open GEX Replay. An active Elite subscription is required.
- Choose a Symbol, Grouping and Session.
- Go to First frame, then press Play.
- Pause around a price move. Compare the OI and Volume profiles at that moment.
- Drag the slider or step one frame at a time.
The Eastern time label and frame counter identify the moment shown. Missing dates mean no stored profile is available for that selection.
Grouping and session are different
| Control | Selects |
|---|---|
| Grouping | Which option expirations are included: 0DTE, Weekly, Monthly or All |
| Session | Which trading day to replay |
| Time slider | A stored moment within that day |
Replay Volume uses traded volume from the selected trading session across all expirations in the selected group. Weekly does not add up a week's volume.
Read the profiles
The 4×1 view shows Gamma and Delta exposure for both OI and Volume. Other layouts let you focus on fewer profiles.
- OI: exposure based on stored open contracts.
- Volume: exposure weighted by that session's traded volume.
- Bars: exposure at each strike.
- Total: net exposure, with color showing its sign.
- Percentage: absolute net divided by gross exposure.
For example, +60 and -40 produce net +20, gross 100 and 20%. A small net does not mean little exposure.
Compare price and levels
Choose Candles or Line for price. Candles use available one-minute OHLC history; a stored profile may exist without a matching candle.
Level source selects OI or Volume for PG, ZG and NG.
| Level display | Shows |
|---|---|
| Current only | Levels at the selected frame |
| Current + History | Current levels and earlier segments |
| History only | Earlier level segments |
History uses separate horizontal segments. When a level changes, the old segment ends without a vertical connector. Missing readings remain gaps. Moving backward hides later history.
Learn PG, ZG and NG. Calculated levels are references, not price predictions.
Make the view easier to read
- Strikes: choose 15, 25, 35 or 50 displayed strikes.
- Price scale: Session High–Low, PG–NG or All Stored Strikes.
- Speed: 60×, 120×, 240× or 480×, about 1, 2, 4 or 8 market minutes per second.
- Refresh replay data: reload the selected session.
Display preferences stay in this browser. The latest session can refresh once per minute while visible, paused and at its last frame. Historical review and active playback do not keep polling.
For aggregate exposure over time, use Exposure Flow.